Bạn thường gặp tình trạng mãi mà không biết viết câu đầu tiên của bài IELTS Writing Task 1 thế nào? Đó là bởi bạn chưa biết cách viết mở bài và overview thế nào cho nhanh và hiệu quả. Hãy nhớ bạn chỉ có 20 phút cho phần Task 1 này thôi. Bài học này sẽ hướng dẫn bạn 03 bước để có thể viết nhanh mở bài và overview chỉ trong 03 phút.
Nếu bạn còn chưa hiểu rõ về IELTS Writing Task 1. Bạn có thể học ngay chương trình học Ultimate Guide on IELTS Writing Task 1 hoàn toàn miễn phí mà chi tiết để có thể giúp bạn có các kiến thức đầy đủ nhất cho IELTS Writing Task 1.
MỞ BÀI THƯỜNG KHÓ VIẾT
Đồng ý với bạn rằng, đặt bút viết câu đầu tiên bao giờ cũng là khó khăn (kể cả tôi khi viết về bài học này cũng vậy). Chúng ta thường cố gắng nghĩ tới một mở bài để viết cho hay nhất.
Và sẽ thế nào nếu bạn nắm được các kỹ thuật để vượt qua phần khó khăn này? Cực kỳ tuyệt vời nhỉ.
Trong bài viết này, tôi sẽ hướng dẫn bạn 3 bước để viết một mở bài thật tốt nhất, đồng thời tôi cũng cung cấp cho các bạn một số mẫu câu và một số lưu ý cần thiết việc viết mở bài trong IELTS Writing Task 1 nhé.
Tuy nhiên, trước đó chúng ta sẽ tìm hiểu kỹ hơn về mở bài trong IELTS Writing Task 1 nhé.
Trước tiên, bạn nên đọc qua bài viết Giới thiệu chung về IELTS Writing Task 1, ở đó tôi có đưa ra ví dụ về một cấu trúc bài viết IELTS Writing Task 1 bao gồm Mở Bài + Thân Bài.
Ở đây tôi có một đề bài mẫu và một hình vẽ cho bài mẫu mà tôi sẽ dùng để hướng dẫn bạn chi tiết từng bước để viết một mở bài thật hay nhé.
Hãy dành ra 1 phút đọc thật kỹ và nhớ hết mọi thông tin của đề bài và hình vẽ này nhé.
You should spend about 20 minutes on this task.
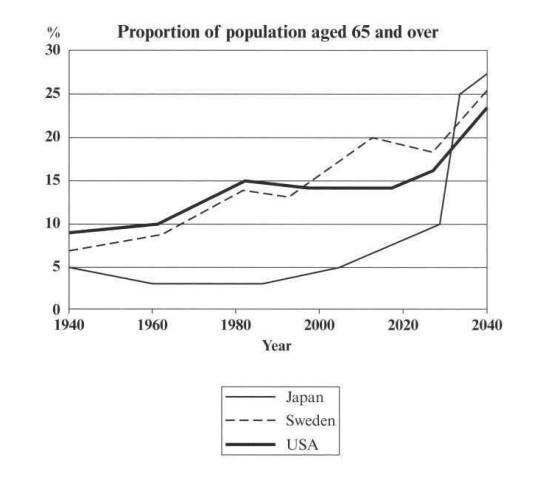
The graph below shows the proportion of the population aged 65 and over between 1940 and 2040 in three different countries.
Summarise the information by selecting and reporting the main features, and make comparison where relevant.
Write at least 150 words.
Trước khi đọc tiếp bài học ở bên dưới, bạn có thể đăng ký để nhận email hàng tuần của tôi. Tôi sẽ gửi bạn những nội dung, tips, hướng dẫn, kinh nghiệm giúp bạn học tiếng Anh và IELTS hiệu quả nhất nhé. Có rất nhiều tài liệu và bài học độc quyền tôi chỉ gửi qua email này thôi đấy. (Nếu bạn đã đăng ký, vui lòng bỏ qua nhé. Rất xin lỗi đã làm phiền bạn)
MỞ BÀI TRONG IELTS WRITING TASK 1
CÁC YÊU CẦU VỀ MỞ BÀI TRONG IELTS WRITING TASK 1
Điều cần chú ý đầu tiên đó là, khi viết về bảng biểu trong IELTS Writing Task 1, chúng ta sẽ không viết giống như khi viết bài luận essay. Kể cả mở bài, chúng ta cũng sẽ viết khác với một bài essay. Điều này tương đương với:
- Bạn sẽ không bị yêu cầu thảo luận về thông tin, chúng ta chỉ có nhiệm vụ tóm tắt lại thông tin mà thôi. Hãy nhìn vào đề bài, bạn có thấy chữ “Summarise“không?
- Thực ra mở bài tương tự như một bài luận là không cần thiết. Nói như vậy có nghĩa là bạn đừng cố gắng nghĩ tới việc đưa thêm thông tin bên ngoài, thông tin chung về chủ đề. Ví dụ ở đề bài trên, chúng ta không cần phải nói những câu kiểu: “we are living in a world of aged population”. Đây là thông tin bên ngoài, không liên quan tới bài viết, viết vào còn bị trừ điểm đấy.
TÔI CÓ CẦN VIẾT KẾT BÀI HAY KHÔNG?
- Bạn không cần thiết phải viết kết bài hay đưa ra bất kỳ kết luận nào chứa ý kiến cá nhân (personal opinion) nhé.
- Và kết bài là không cần thiết nếu bạn thực hiện theo hướng dẫn viết mở bài như trong bài này. Đó là bởi mở bài đã chứa toàn bộ thông tin rồi, nếu cố viết kết bài sẽ bị lặp thông tin.
- Và một bài tóm tắt summarise thì không cần bắt buộc một kết bài đâu nhé.
MỞ BÀI TRONG IELTS WRITING TASK 1 GỒM NHỮNG GÌ?
Các kiến thức ở phần này là cực kỳ quan trọng đấy nhé.
Mở bài trong IELTS Writing Task 1 cần đạt được các yêu cầu và mục đích sau đây:
- Giới thiệu rõ ràng cho người đọc biết về chủ đề, đối tượng, thời gian của hình vẽ.
- Đưa ra thông tin tổng quát chung về data, số liệu, dữ liệu của hình vẽ.
Như vậy mở bài trong IELTS Writing Task 1 gồm 2 thành phần: Introductory Sentence và Overview Sentence
LƯU Ý!
Cảm ơn bạn đã đọc bài viết này. Mình rất mong bạn dành vài giây để đọc thông tin này nhé.
Lớp học tiếng Anh mất gốc Online English Boost sắp khai giảng giúp bạn lấy lại tự tin trước khi học IELTS, hãy nhanh tay đăng ký nhé.
Nếu bạn đang học IELTS Writing nhưng mãi chưa viết được bài hoàn chỉnh hoặc mãi chưa tăng điểm. Đó là do bạn không có người hướng dẫn chi tiết và không được chữa bài, hãy đăng ký khóa học IELTS Online Writing 1-1 với đặc trưng là tất cả bài viết đều được chữa chi tiết nhiều lần bởi giáo viên và cựu giám khảo, đã giúp tăng 0.5 chấm trong 2 tuần.
Nếu bạn đang gặp khó khăn khi bắt đầu việc học IELTS 4 kỹ năng đừng tự mò mẫm nữa. Để tiết kiệm thời gian và chi phí, bạn có thể đăng ký ngay khóa học IELTS Online Completion 4 kỹ năng để học từ cơ bản tới nâng cao, với chi phí thấp, có tương tác trực tiếp rất nhiều với giáo viên, đã giúp rất nhiều bạn đạt 6.5 – 8.0 chỉ với chi phí cực ít.
Nếu bạn đang luyện thi IELTS Speaking và Writing mà gặp khó khăn với từ vựng do quá nhiều chủ đề và quá nhiều từ vựng cần học. Nếu bạn không biết nên ôn Reading và Listening thế nào. Bạn nên sử dụng bộ đề IELTS Dự Đoán Mỳ Ăn Liền có kèm đáp án chi tiết đầy đủ cũng như các giới hạn đề thi. Đề cập nhật thường xuyên giúp bạn ôn thi tốt hơn.
Cảm ơn bạn đã dành thời gian xem thông tin.
INTRODUCTORY SENTENCE
Câu Introductory Sentence làm nhiệm vụ giúp người đọc hiểu nhanh một chút về việc họ sẽ đọc được thông tin về điều gì trong bài viết. Ví dụ:
- Họ sẽ biết được rằng họ đang đọc về biểu đồ hay process hay bản đồ.
- Họ đọc về chủ đề tỉ lệ dân số, tỉ lệ thất nghiệp, hay số lượng ô tô bán ra, hay nhiệt độ trung bình.
- Họ cũng có thể biết được rằng các thông tin này xảy ra trong giai đoạn từ 1900 – 2000 hay xảy ra trong các tháng trong năm, hay được so sánh theo các nhóm tuổi …
Rất nhiều thông tin sẽ cần được viết trong một câu Introductory Sentence này. Hãy làm chính xác các bước như hướng dẫn ở dưới để nắm được cách viết nhé.
OVERVIEW SENTENCE
Theo như bài viết Giới thiệu tổng quan về IELTS Writing Task 1 , bạn sẽ cần phải viết một câu chứa overview của toàn bài. Đó chính là câu Overview Sentence.
Câu này làm nhiệm vụ cung cấp cho người đọc biết rằng mối quan hệ giữa các thông tin cụ thể trên hình vẽ thế nào.
Ví dụ:
- Họ sẽ nắm được rằng các thông tin ở hình vẽ chủ yếu là thể hiện sự tăng lên của tỉ lệ dân số ở các nước.
- Hoặc, họ có thể biết được là ô tô chiếm phần lớn trong các loại phương tiện tại châu Âu
- Hoặc, họ có thể biết rằng hình vẽ nói về rất nhiều sự thay đổi của một thành phố.
Chính vì sự quan trọng như vậy nên câu Overview Sentence sẽ cần phải rất rõ ràng về thông tin và rõ ràng về cấu trúc.
Đôi khi tôi hay khuyên học sinh rằng hãy viết thật đơn giản mà chính xác ở câu này, đừng dùng các cấu trúc ngữ pháp phức tạp gì cả.
Để có thể thực hiện tốt 2 thành phần của Introduction, các bạn cần lưu ý thực hiện theo 3 bước sau đây để có thể viết được một mở bài tốt nhất cho IELTS Writing Task 1 nhé.
3 BƯỚC ĐỂ VIẾT NHANH VÀ ĐÚNG MỞ BÀI TRONG IELTS WRITING TASK 1
Với 3 bước này, bạn sẽ viết được rất nhanh và đúng mở bài trong IELTS Writing Task 1, và dành thời gian cho việc viết thân bài body paragraph.
Bước 1: Nhận diện hình vẽ và thông tin chi tiết về hình vẽ
Bước 2: Kết luận về Overview
Bước 3: Cân nhắc ngôn ngữ và Viết
Bây giờ chúng ta sẽ xem chi tiết cách làm từng bước nhé, tôi vẫn sử dụng đề bài mẫu ở trên để hướng dẫn các bạn nhé. Các bạn nên đọc kỹ phân tích này, sau đó kết hợp xem video ở dưới để hiểu rõ ràng hơn nhé.
Đề bài
You should spend about 20 minutes on this task.
The graph below shows the proportion of the population aged 65 and over between 1940 and 2040 in three different countries.
Summarise the information by selecting and reporting the main features, and make comparison where relevant.
Write at least 150 words.

BƯỚC 1: NHẬN DIỆN HÌNH VẼ VÀ THÔNG TIN CHI TIẾT VỀ HÌNH VẼ
Ở bước 1 này, chúng ta sẽ cần tới các kiến thức về các dạng bài IELTS Writing Task 1, mời các bạn xem lại nếu chưa nắm vững nhé. (Cách phân loại của tôi rất chi tiết, nên có thể các bạn cần phải xem để rõ ràng về từng dạng nhé)
Nhiệm vụ của bạn đó là nhận diện các thông tin sau:
- Loại hình vẽ nào
- Đối tượng trong hình là gì
- Mốc thời gian là gì
- Đơn vị, cách đo lường là gì
Áp dụng vào bài này ta có:
- Đây là dạng bài biểu đồ đường – line graph
- Đối tượng trong bài là tỉ lệ dân số của 3 nước là Nhật, Thụy Điển và Mỹ – the proportion of population aged 65 and over in Japan, Sweden and the USA.
- Mốc thời gian là từ 1940 tới 2040 (bao gồm giai đoạn dự báo)
- Đơn vị là % (percent)
Một lát nữa, tới bước 3 chúng ta sẽ bắt đầu viết nhé. Nhưng bạn để ý kỹ một chút là hầu như thông tin này có ở đề bài rồi đó. Như vậy, hãy đọc kỹ đề bài hơn một chút và nhìn hình kỹ hơn một chút ở lần tới nhé.
Bạn nên xem video để hiểu rõ hơn.
BƯỚC 2: KẾT LUẬN VỀ OVERVIEW
Để phân tích và đưa ra kết luận về Overview, bạn cần có cái nhìn tổng quan một chút. Một số gợi ý cho bạn để có thể đưa ra overview nhanh nhất nhé:
- Nhìn xu hướng chung thấy tăng lên hay giảm đi (so sánh điểm đầu và điểm cuối)
- Cái gì là cao nhất hay thấp nhất
- Có bao nhiêu bước, hay quá trình nào phức tạp hơn quá trình nào (dạng process)
- Có nhiều thay đổi không, thay đổi diễn ra chủ yếu ở bản đồ nào (dạng maps)
Áp dụng vào bài này, chúng ta sẽ có các thông tin sau đây:
- Cả 3 đường này đều đi lên, như vậy xu hướng chung của chúng là tăng
- Giá trị của Sweden và USA thì thay đổi vị trí trong toàn quá trình, còn riêng Japan thì phần lớn thời gian là nhỏ nhất.
- Phần giai đoạn cuối (dự báo) thì giá trị của Nhật cao nhất.
Tất nhiên, chúng ta không thể đưa vào hết tất cả thông tin, bạn có thể chọn 2 thông tin trong số các thông tin trên. Tôi chọn xu hướng chung của toàn hình vẽ và chọn giai đoạn dự báo của Nhật.
Lí do tại sao thì bạn có thể xem ở trong video để biết rõ hơn nhé.
BƯỚC 3: CÂN NHẮC NGÔN NGỮ VÀ VIẾT
Trong bước 3 này, bạn bắt đầu viết và suy nghĩ về cách thể hiện các thông tin thế nào để viết thành câu. Đây chính là bước cuối cùng để hoàn thiện mở bài trong IELTS Writing Task 1
CÁC CẤU TRÚC CHO VIẾT MỞ BÀI
Để viết mở bài bạn có thể sử dụng các cấu trúc dưới đây nhé:
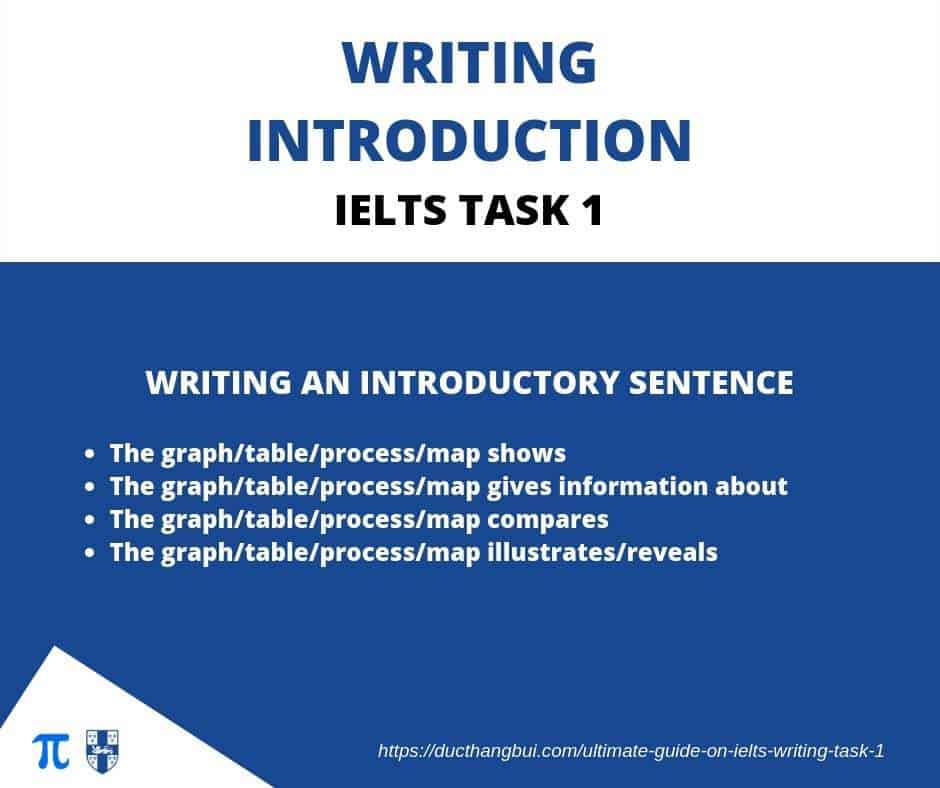
- The graph/table/process/map shows
- The graph/table/process/map gives information about
- The graph/table/process/map compares
- The graph/table/process/map illustrates/reveals
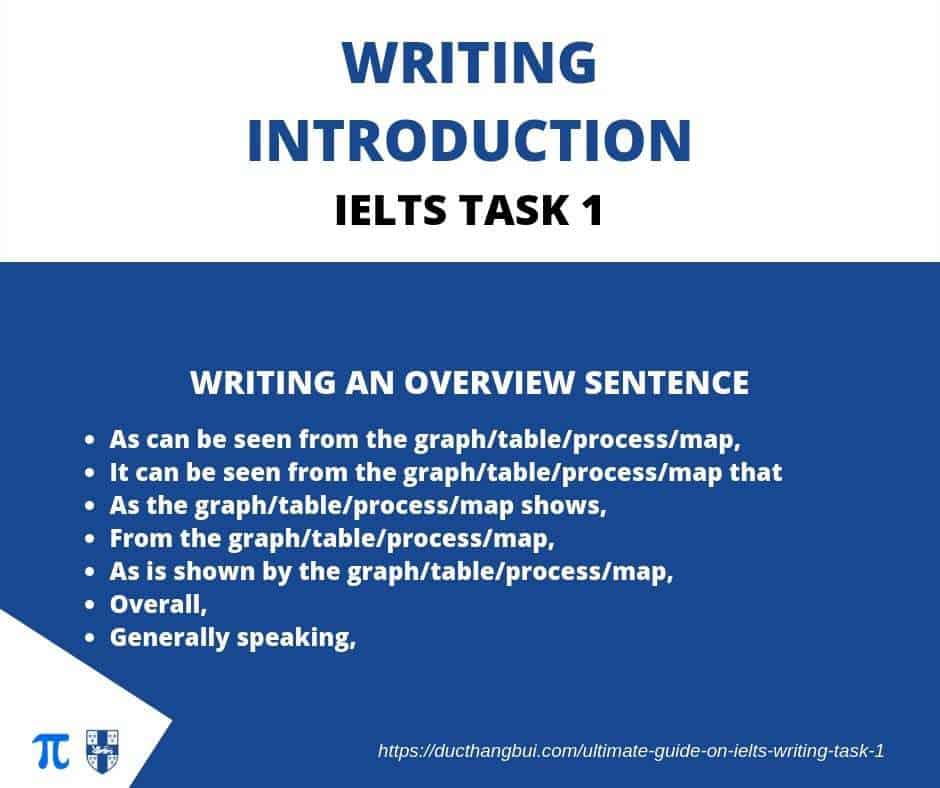
- As can be seen from the graph/table/process/map,
- It can be seen from the graph/table/process/map that
- As the graph/table/process/map shows,
- From the graph/table/process/map,
- As is shown by the graph/table/process/map,
- Overall,
- Generally speaking,
Trong đó, bạn có thể sử dụng các cấu trúc sau để viết Introductory Sentence
Và các cấu trúc sau để viết Overview Sentence
Trong đó thì tôi thường chỉ dùng ‘Overall,’ là đủ, ngắn gọn, đơn giản và ít phải nhớ nhiều.
Chú ý:
Tránh sử dụng cấu trúc: according to the graph. Lí do là cụm according to thường được sử dụng để nói về nguồn thông tin là từ người khác (hoặc nguồn khác), và không phải từ bạn. Trong khi đó thì thông tin ở đây là ở trên hình vẽ, và bạn và người đọc đều có hình vẽ, vậy thì bạn đâu cần phải trích dẫn từ nguồn khác đâu?
Đừng dùng sai cấu trúc as can be seen from thành as it can be seen from nhé. Ở đây chúng ta không có chủ ngữ giả IT đâu đấy.
Theo như khuyến cáo của Pauline Cullen thì bạn không nên dùng cấu trúc số 4, tuy nhiên, nhiều người vẫn sử dụng (kể cả giám khảo) nên tôi vẫn tạm đưa vào đây. Tuy nhiên, tôi theo ý kiến từ Cullen nên khuyên bạn nên dùng 3 cấu trúc đầu (thế là quá đủ rồi)
- The graph/table/process/map shows
- The graph/table/process/map gives information about
- The graph/table/process/map compares
Viết mở bài
Áp dụng các kiến thức trên, chúng ta sẽ viết được mở bài dưới đây
The graph compares the proportion of the 65 and over aged population from 1940 to 2040 in 3 countries. The population in Sweden, Japan and the USA have been ageing and Japanese population is predicted to be younger than 2 other ones.
Bạn hãy xem video để nắm được rõ hơn cách viết nhé. Tôi phân tích rất kỹ và gợi ý nhiều cách cho bạn để viết mở bài trong video (do là gõ ra khó hơn là nói)
BÀI TẬP VIẾT MỞ BÀI TRONG IELTS WRITING TASK 1
Bạn đã nắm được các kiến thức lý thuyết về cách viết mở bài trong IELTS Writing Task 1 rồi, bây giờ chúng ta cùng làm một vài bài tập dưới đây nhé.
Bạn có thể làm bài bằng cách comment sau đó xem đáp án. Đừng xem đáp án trước nhé.
Các bạn học sinh các lớp IELTS Trực tiếp và IELTS Online 4 Kỹ năng và IELTS Writing Online cần làm bài nghiêm túc bằng cách comment phía dưới đây để nộp bài tập. Hãy nghiêm túc làm bài nhé.
BÀI TẬP 1
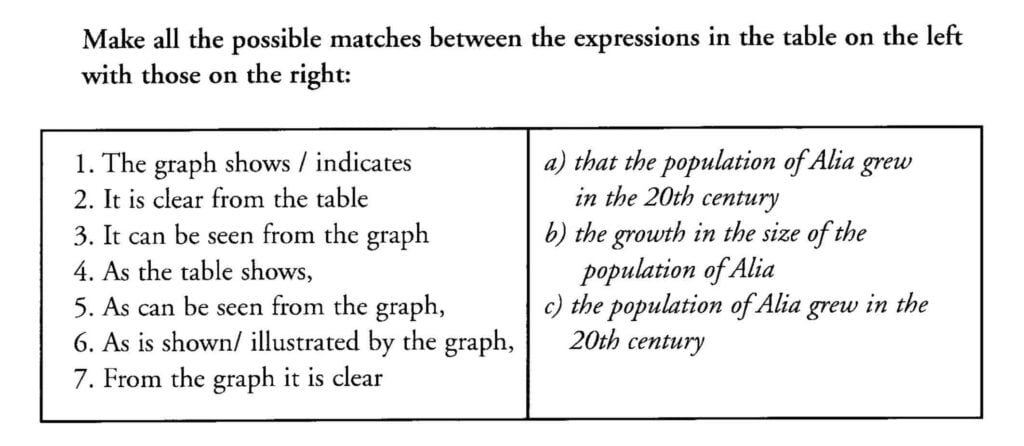
Nối các câu để có được mở bài tốt nhất
BÀI TẬP 2
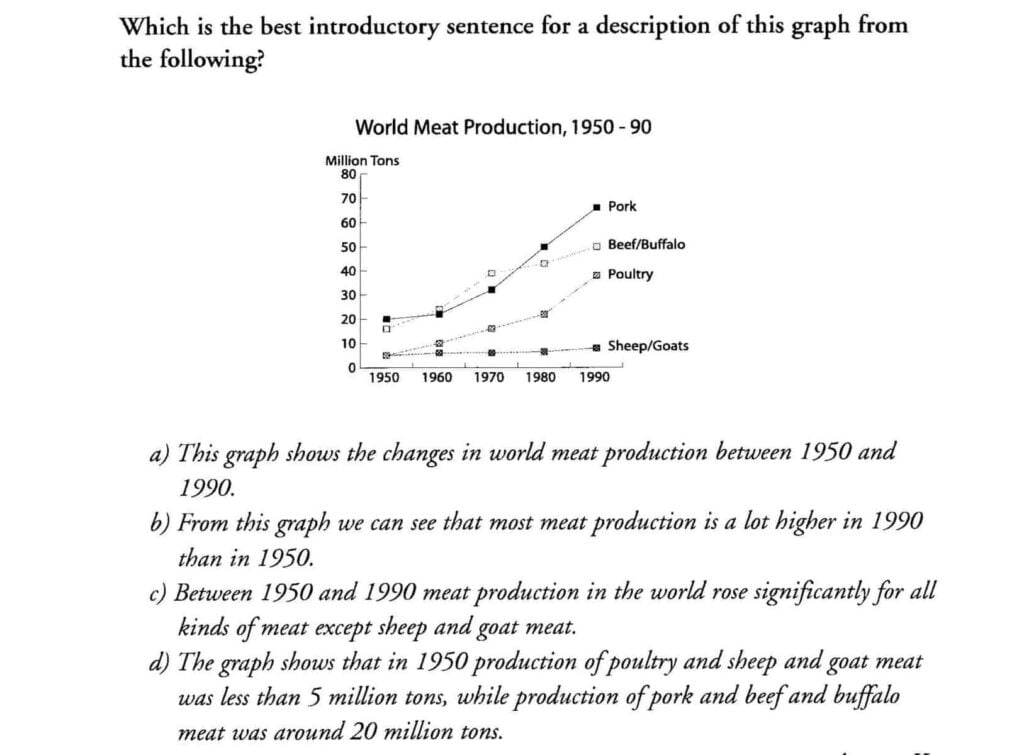
Chọn mở bài tốt nhất cho hình vẽ
BÀI TẬP 3
Thực hành viết mở bài cho đề bài dưới đây
You should spend about 20 minutes on this task.
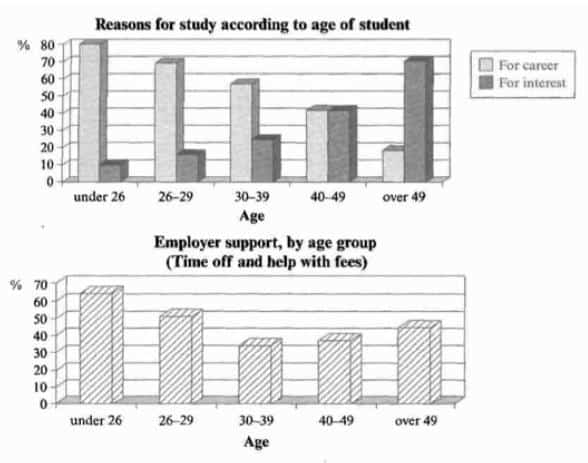
The chart below show the main reasons for study among students of different age groups and the amount of support they received from employers.
Summarise the information by selecting and reporting the main features, and make comparison where relevant.
Write at least 150 words.
ĐÁP ÁN BÀI 1

ĐÁP ÁN BÀI 2
Câu c là đáp án đúng nhất
ĐÁP ÁN BÀI 3
Suggested answer
The charts show why students at different age groups study and how much support they received from their employers. Younger students study mainly for career rather than study for interest, and they receive more support from employers than older students.
Bài 1:
1-a,b
2-a
3-a,c
4-b,c
5-c
6-b,c
7-a
Bài 2:d
Bài 3:
The charts illustrate that why students at different age groups and the percentage of support they received from employers. The proportion of students who study for career purposes is higher than the younger age groups, while the oldest students are more likely to study for interest
Bài 1:
1 – a,b
2 – a
3 – a
4 – c
5 – c
6 – c
7 – a
Bài 2:d
Bài 3:
The chart gives information about the main reasons for study among students of different age groups and the amount of support they received from employers. Overall, younger students study mainly for careers rather than study for interest and they received more support from employers too compare with older students.
B1:
1-a,b
2-a
3-a
4-c
5-c
6-b,c
7-a
B2
d
B3
The charts give information about the main reasons for study among students of different age groups and the amount of support they received from employers. Overall, the proportion of students who study for career rather than study for interest and they received more supported than older student