Hướng Dẫn Chi Tiết Cấu Trúc Dự Đoán Prediction Ielts Task 1
Nói về tương lai trong IELTS Writing Task 1 Academic không đơn giản
Thực ra, rất nhiều bạn học sinh của tôi tại các lớp IELTS trực tiếp, IELTS Online hay thậm chí IELTS Writing Advanced cũng đều nghĩ rằng:
“Trong IELTS Writing Task 1, nếu cứ gặp thông tin ở tương lai thì cứ đơn giản là dùng ‘will’ thôi chứ có gì đâu.”
Nhưng, thực tế lại là bạn không thể chỉ nói điều gì đó là will happen. Bạn chỉ có thể dự đoán rằng nó có thể xảy ra chứ không phải sẽ xảy ra. Tức là bạn chỉ có thể dùng ‘may’ hoặc ‘could’.
Tuy thế, modal verbs như may hay could lại thiếu rõ ràng, không chắc chắn, (và theo một giám khảo nói với tôi thì modal verbs này mang yếu tố chủ quan mà chúng ta lại cần phải khách quan).
Đó chính là lí do tôi hướng dẫn các bạn về cấu trúc dự đoán, cấu trúc dự báo tương lai trong IELTS Writing Task 1.
ULTIMATE GUIDE ON IELTS WRITING TASK 1
Một chương trình học IELTS Writing Task 1 đầy đủ, khoa học và chi tiết với nhiệm vụ giúp bạn có thể tự học IELTS Writing Task 1 và đạt Band 6-5 - Band 7.0+. Đổi lại bạn chỉ cần dành ra 30 phút cho mỗi bài học, làm bài tập đầy đủ và học tập thật sự nghiêm túc.
Chương trình hoàn toàn miễn phí!!!
Cấu trúc dự đoán tương lai prediction trong IELTS Writing Task 1 Academic
Để nói về sự dự đoán trong tương lai thì chúng ta có thể sử dụng cấu trúc:
It is predicted/forecast/expected/suggested/likely that
Trong đó bạn lưu ý là cấu trúc sau được ưa chuộng hơn, đó là: it is predicted that … và it is likely that …
Và nhớ là sau that là một mệnh đề đầy đủ nhé.
Và khi bạn sử dụng cấu trúc này thì ở mệnh đề sau that, bạn sẽ có thể sử dụng will rồi nhé.
Ví dụ:
It is predicted that the population will increase to 8 billion at the end of this century.
Một cấu trúc khác bạn cũng có thể sử dụng đó là:
… is expected/forecasted/predicted
Ví dụ:
An increase in the population to 8 billion is predicted at the end of this century.
Bên cạnh đó bạn có thể nói rằng:
Over the period of prediction, the population will increase to 8 billion.
(Với điều kiện là giai đoạn dự đoán period of prediction là trùng với thời gian bạn muốn nói nhé).
KHÓA HỌC CHỮA BÀI IELTS WRITING
Bạn luôn cảm thấy kỹ năng IELTS Writing không có tiến bộ vì viết bài IELTS Writing mà không có người chữa? Bạn có thể đăng ký chữa bài cùng tôi. Tôi đã giúp các bạn học viên chăm chỉ nâng từ 1 tới 2 band điểm sau khóa học, liệu bạn có thể nâng điểm như vậy?
Ví dụ về cấu trúc dự đoán trong bài IELTS Writing Task 1
Ở đây mình lấy một bài ví dụ (rất điển hình) về cấu trúc dự đoán và áp dụng vào trong bài viết mẫu nhé. Bạn hãy phân tích đề, sau đó xem 2 bài mẫu ở dưới và các cấu trúc dự đoán đã được highlighted rồi nhé.
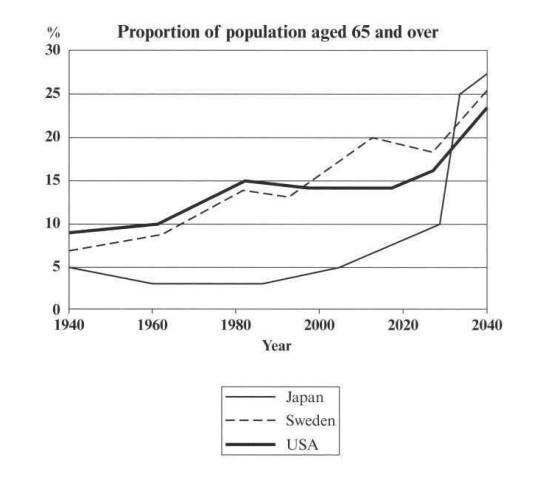
The graph below shows the proportion of the population aged 65 and over between 1940 and 2040 in three different countries.
Summarise the information by selecting and reporting the main features, and make comparison where relevant.
Write at least 150 words.
Sample answer
Since 2000, Swedish population is predicted to be older than American population and probably continue to increase in the next 40 years. However, the proportion of older people in Japan is predicted to dramatically rise from 2030, and Japanese population will become the oldest among 3 countries in the late 2030. In 2040, it is thought that the proportion of the population aged 65 and more in these countries will be similar at around 25%.
Another sample answer
From 2000, it is predicted that Swedish population will become older than American, and Japanese aged population will suddenly boom and will become oldest among 3 countries. In 2040, people aged 65 and over accounted for a quarter of total population in 3 countries.
Bài tập cấu trúc dự báo tương lai prediction
Các bạn viết bài viết dưới đây để áp dụng các kiến thức về cấu trúc dự báo tương lai nhé. Sau đó comment vào bên dưới nhé.
Các bạn học sinh các lớp IELTS Trực tiếp, IELTS Online và IELTS Writing Advanced làm bài nghiêm túc bằng cách comment ở dưới để giáo viên theo dõi tiến bộ và có feedback phù hợp cho lộ trình học.
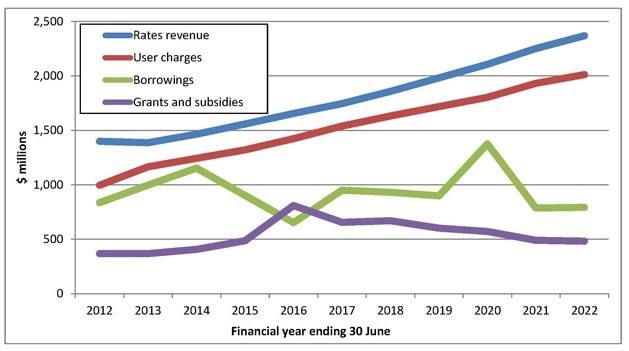
The line graph shows the past and projected finances for a local authority in New Zealand.
Summarize the information by selecting and reporting the main features and make comparisons where relevant.
Write at least 150 words.
Chúc bạn học tốt
Hãy đăng ký khóa học IELTS Online - Học trực tuyến như học trực tiếp cực kỳ hiệu quả
The line graph illustrates the past and predicted finances for a local authority in New Zealand from 2012 to 2022. As can be seen from the graph, while both the rates revenue and the user charges saw an significantly increase, the borrowings and the grants and subsidies fluctuated during the period of time.
In 2012, the rates revenue stood at nearly 1500 millions and it slightly fall till 2013. From that time on, this figure rocketed from 1500 to more than 2000 millions of dollars. At the same time, the figure for the user charges saw an upsurge from 1000 to 2000 millions. From that time on, both categories are predicted to rise to approximately 2500 for the rates revenue and 2000 for the user charges in the next year.
The borrowings stood at more than 500 then went up to more than 1000 in the period from 2012 to 2014. Over the next 7 years, the figures saw an significantly fluctuation and it is expected to stay unchanged in 2022. Meanwhile, the grants and subsidies stood at nearly 500 in 2012 then slightly increased until 2015. This category reached a peak at approximately 1000 in 2016 then saw an downward trend in the period between the end of 2016 and 2022.
The line graph illustrates the previous finances of a New Zealand local authority and its forecast in a decade with 4 different categories.
Overall, rates revenue and user charges tend to increase while borrowings, grants and subsidies have some fluctuation during the period of ten years.
In 2012, rates revenue stood at nearly 1500 and remain steadily until 2013. Then, there was a jump and it is predicted that it will rise to nearly 2500 in 2022. At the same time, user charges have never gone down or had any fluctuation. An increase to 8 billion is predicted at the end of this period.
In contrast, borrowings stood at nearly 800 in 2012, however, the figure fluctuated from this time to the next 9 years. It is likely that the figure will fall and remain constant at about 700 in 2022. Meanwhile, grants and subsidies reached a peak at approximately 700 then will drop dramatically to about 500 as forecast.
The line graph gives information about the finances for a local government in New Zealand in the past and its future projects with 4 categories. Overall, rates revenue and users charges are likely to grow significantly while borrowings and grants and subsidies are predicted to go up and down.
After having a low point at about 1300 in 2013, the quantity of rates revenue increased steadily and it is expected that this figure will have a continuous grow and be at about 2400 in 2022. Also, it is forecasted that the number of user charges will have a substantial rise from 2012 to 2022, but under the number of rates revenue and to be at 2000 is predicted in 2022.
The quantity of borrowings fluctuated between about 700 and 1200 before having a peak at about 1400 in 2020. It is expected that this figure will decrease significantly by 600 millions dollars in 2021 and followed by staying unchanged in 2022. With the number of grants and subsidies, it raised moderately before reached a highest point at 800 and followed by a slow drop between 2016 and 2020. It is expected that this figure will remain stable until 2022.
The given line graph compares 4 different financial categories in the past and projected future for a local authority in New Zealand from 2012 until 2022.
Overall, rates revenue and user charges increase sharply and it is predicted that the figure will continue rising while borrowings and grants and subsidies will slightly rise over the next fer years.
In 2012, rates revenue remained stable under 1,500 millions while user charges slightly increased around 1,200 millions. From 2013 to 2020, both groups rapidly rise and the amount of both are expected to continue go up under a peak of 2,500 millions in 2022.
Borrowings and grants and subsidies between 2012 and 2014 only rise moderate. It is expected that borrowings and grants and subsidies will stay unchange.
The provided graph gives information about finances for a local authority in the past and a prediction of how much of it will be needed in the future. As can be seen from the chart, the amount of rates revenue and user charges both undergoes an upward trend and is forecast to rise even higher whereas the figure of other components remain much lower.
In 2012, the amount of rate revenue stood at nearly 1,500 millions and continued to increase by over 500 millions until 2021. The same situation can be clearly seen in the figure of user charges, which experienced a significant rise of approximately 1000 millions over the past 9 years. From 2022, both of the categories are expected to grow and reach its peak at about 2,350 millions for the rates revenue and 2000 millions for user charges.
On the contrary, the amount of grants and subsidies remain very low, starting from under 500 millions to its highest point of about 700 millions in 2016. From this time on, the figure dropped to only 490 millions in 2021 and is predicted to fall in the future.
Different from the remaining components, the borrowings witnessed quite a lot of ups and downs in its figure as it began at 800 millions in 2012 and reached to the lowest point in 2016. However, it rose dramatically to a high of nearly 1500 millions in 2020 and is suggested to go down till 2022.
The line graph illustrates the past and projected finances for a local authority in New Zealand. Overall, while the figure of rates revenue and user charges are on a rise and are forecast to increase, the borrowings and grants and subsidies will remain much lower.
In 2012, rates revenue, which stood approximately at 1,500 million, was the highest of the 4 categories, followed closely by user charges, at exactly 1000 million. From 2013 until 2019, there was a continuous growth of the figure for both categories before being expected to reach about 2500 and 2000 million in 2022.
In contrast, the figure for borrowings and grants and subsidies were the lowest in the comparison of both categories to the others, at about 1000 and 500 million. Over the next 8 years, there was a fluctuation of borrowings between 1000 and 1500 million, but still reaching a peak of its periods, stood at around 1500 million. After that, it is predicted to decline from the top to 700 million and remain stable from 2021 until 2022. And of the 4 categories, grants and subsidies were the lowest over the whole period, even though there was a peak in 2016 at 700, a slow decrease is expected until 2022.
The line paragraph illustrates the past and projected finances for a local authority in New Zealand. Overall, it can be seen that while the rates revenue and user chargers are forecasted to increase gradually over the period shown, the figures for borrowings and grants and subsidies will remain much lower. In 2012, rates revenue remained stable under 1,500 millions while user charges slightly increased around 1,200 millions. From 2013 to 2020, both groups rapidly rise and the amount of both are expected to continue go up under a peak of 2,500 millions in 2022. There was a downturn in borrowings from 2012 to 2016 and then an upturn to reach a peak at nearly 1,500 millions from 2016 to 2020. It is likely that borrowings will have a decline and remain stable. Grants and subsidies has been the lowest over the given period, even though there was a peak in 2016, it is expected to fall slowly until 2022.
The line paragraph indicates about the past and projected finances for a local authority in New Zealand. Overall, while the rates revenue and user charge rose and are predicted that they will go up, the borrowings and grants and subsidies remained unchanged.
In 2012, rates revenue remained stable under 1,500 millions while user charges increased around 1,200 millions. Betweem 2013 and 2020, both groups rapidly rose and the amount of both are likely to continue going up under 2,500 millions in 2022.
Borrowings and grants and subsidies from 2012 to 2014 only increased moderate. It is expected that borrowings and grants and subsidies will stay unchanged.
The line paragraph illustrates the past and projected finances for a local authority in New Zealand. Overall, while the rates revenue and user charge was on a rise and are predicted to go up, the borrowings and grants and subsidies still remained unchanged.
Among 4 finances, rates revenue has been the highest. From 2012 to 2013, rates revenue stayed at the same level. From that time, there was an upward trend and an increase to 2,500 millions is predicted in 2022. User charges followed secondly with the incremental growth and is predicted to peak at 2,000 millions in 2022. There was a downturn in borrowings from 2012 to 2016 and then an upturn to reach a peak at nearly 1,500 millions from 2016 to 2020. It is likely that borrowings will have a decline and remain stable. Grants and subsidies has been the lowest over the given period, even though there was a peak in 2016, it is expected to fall slowly until 2022.
The line paragraph illustrates the past and projected finances for a local authority in New Zealand.
Overall, it can be seen that grants and subsidies was slightly growth during the first 3 years. After that, it dramatically increased in 2016, reaching a point at 800 millions. Borrowings increased from 800 to 1150 millions in the period between 2012 and 2014, then it significantly declined over the next 2 years, peak at the lowest point, even lower than grants and subsidies. The figures of rates revenue and user changes was rise substantially throughout the first 4 years.
Since 2018, grants and subsidies is predicted to be the lowest of 4 categories. Borrowings is likely that it will fluctuate between 1000 and 1450 millions. The finances of rates revenue and user changes will continue to increase above 2000 millions over the period of prediction.
The line graph indicates information about the movement of projected finance in New Zealand from 2012 to 2022.
Overall, rates revenue and user charges increase sharply and it is predicted that the figure will continue rising while borrowings and grants and subsidies will slightly rise over the next fer years.
In 2012, rates revenue remained stable under 1,500 millions while user charges slightly increased around 1,200 millions. From 2013 to 2020, both groups rapidly rise and the amount of both are expected to continue go up under a peak of 2,500 millions in 2022.
Borrowings and grants and subsidies between 2012 and 2014 only rise moderate. It is expected that borrowings and grants and subsidies will stay unchange.
The given line graph compares 4 different financial categories in the past and projected future for a local authority in New Zealand from 2012 until 2022.
Overall, it can be seen that while the rates revenue and user chargers are forecasted to increase gradually over the period shown, the figures for borrowings and grants and subsidies will remain much lower.
In 2012, rates revenue, which stood at approximately 1500 millions, was the highest of the 4 categories, followed closely by user charges, at exactly 1000 millions. From 2013 until 2019, the figures for both groups experienced a continuous increase before being predicted in 2022 to reach about 2500 and 2000 millions respectively.
In contrast, in the year 2012, the figures for borrowings and grants and subsidies were significantly lower in comparison to those of the other 2 categories, at around 1000 and 500 millions respectively. Over the next 8 years, borrowings witnessed a dramatic fluctuation, but still reaching the highest point of its period, stood at around 1500 millions. After that, it is expected to decline sharply and remain unchanged, at about 800 millions in 2022. And of the 4 financial categories, grants and subsidies were the lowest over the given period, even though there was a peak in 2016, it is expected to fall slowly until 2022.